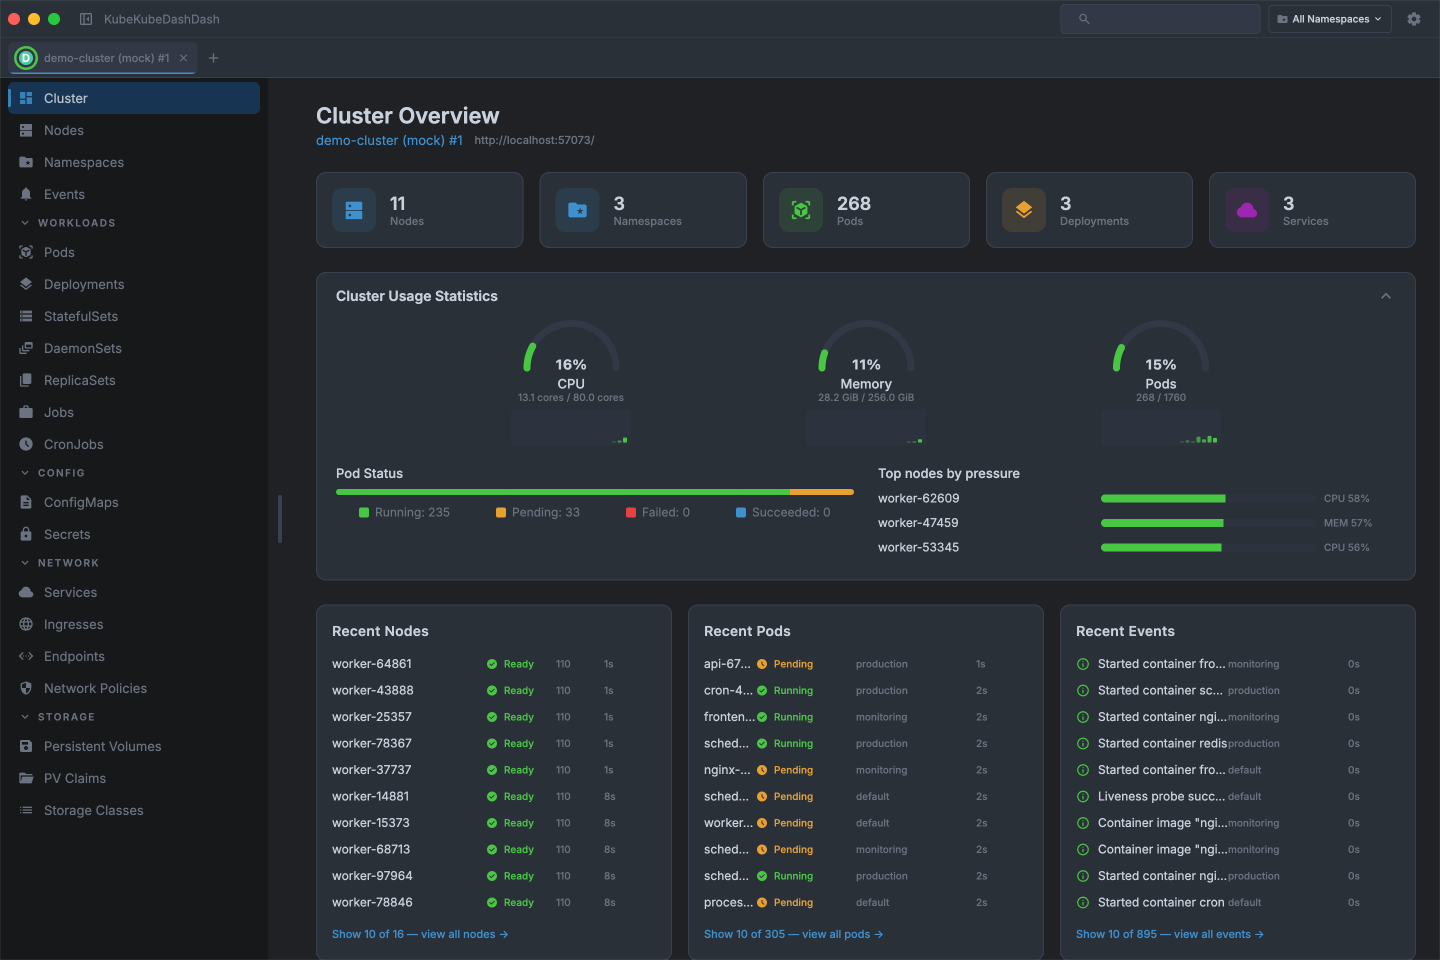
Cluster overview
See your cluster's health at a glance — CPU and memory usage, node count, running pods, and a live event stream all on one screen.
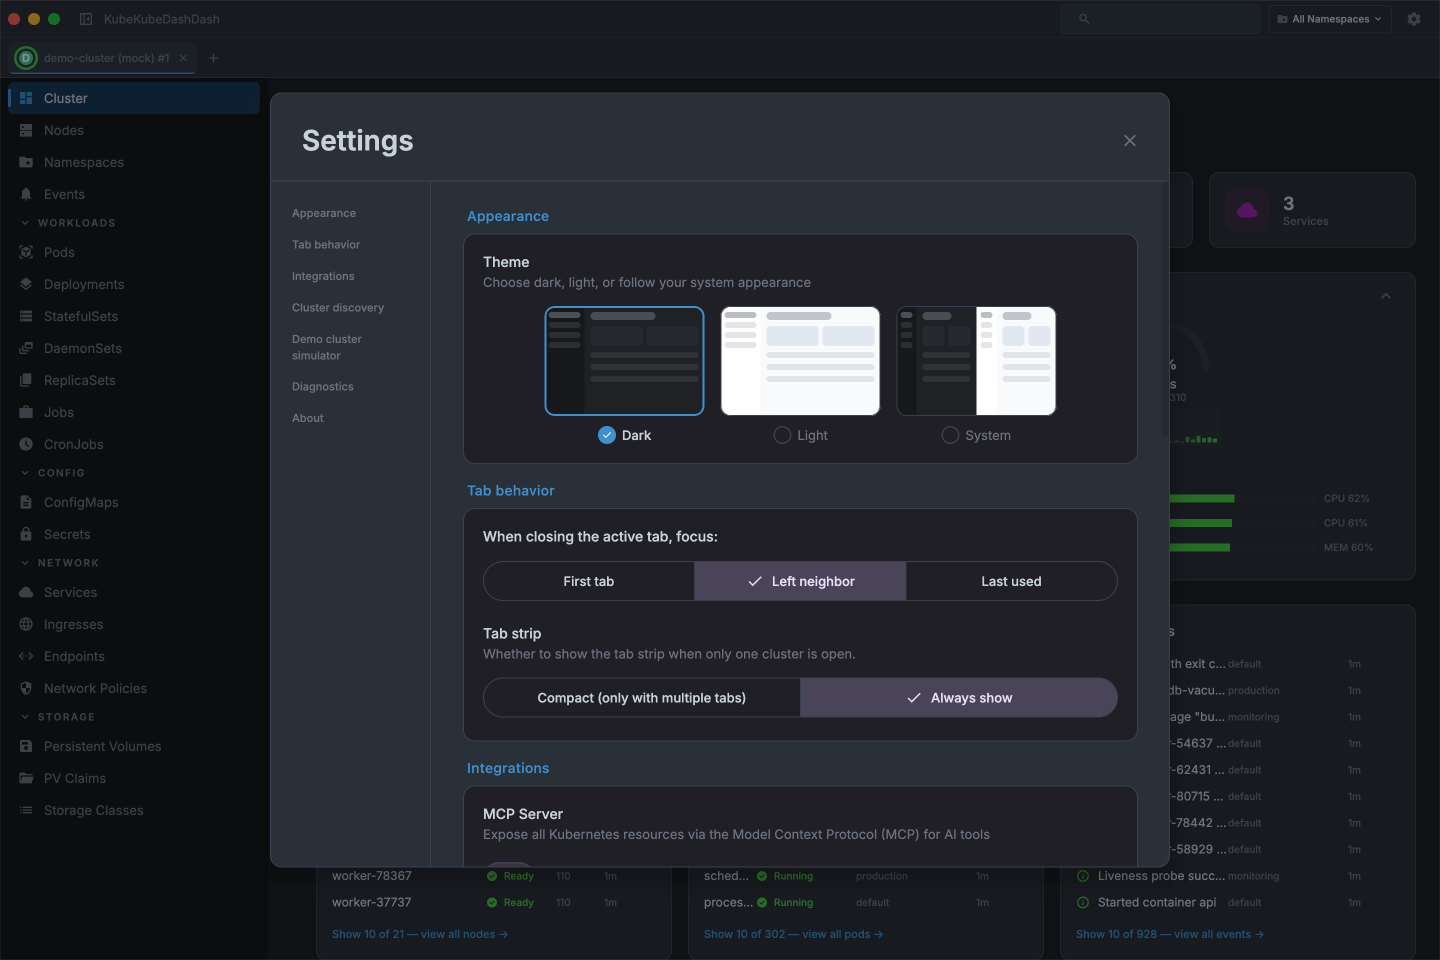
Light & dark themes
Pick dark, light, or follow the system — every screen, panel, and chart adapts.
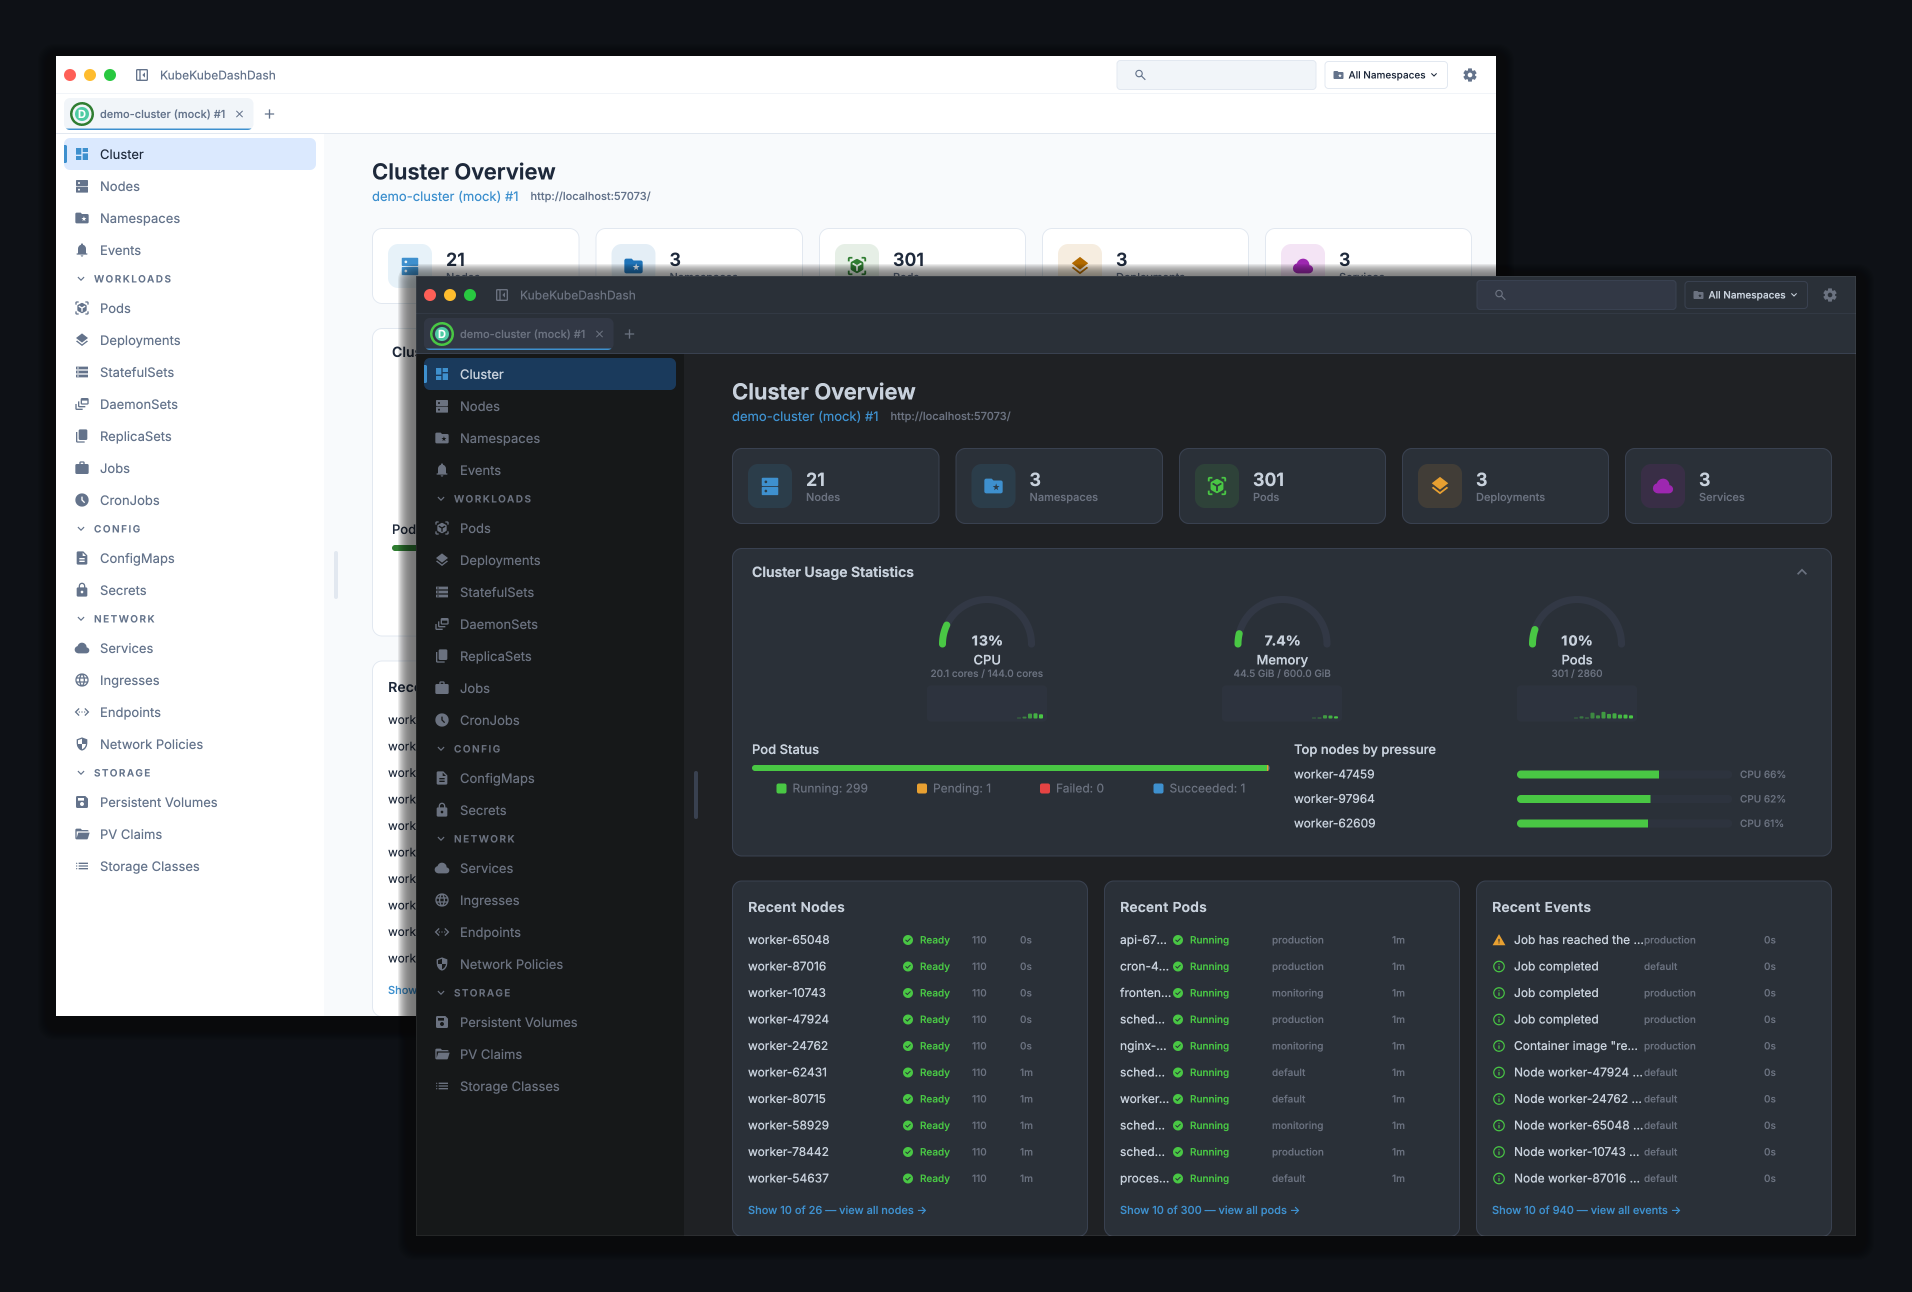
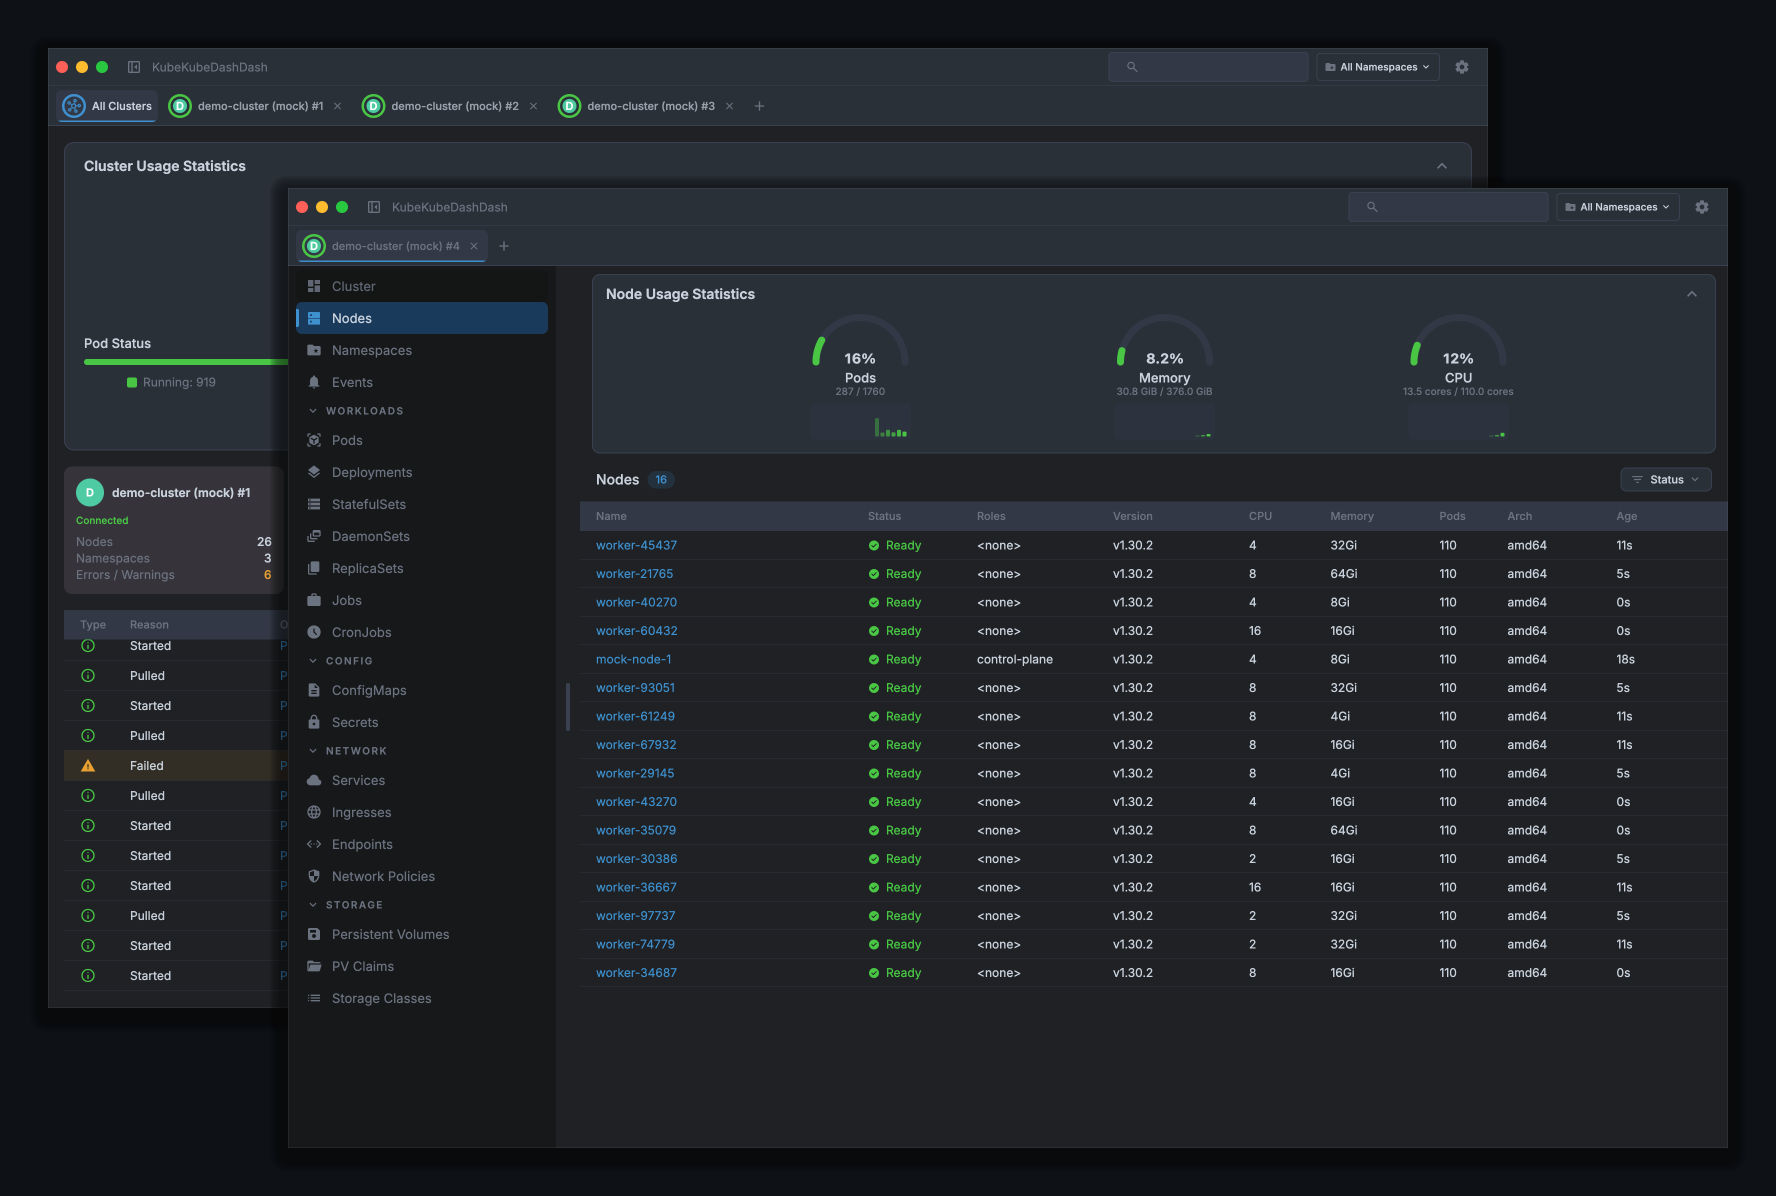
Many windows, many tabs
Each cluster gets its own tab. Drag a tab between windows to reorganize, or tear one off into a new window — the connection moves with it.
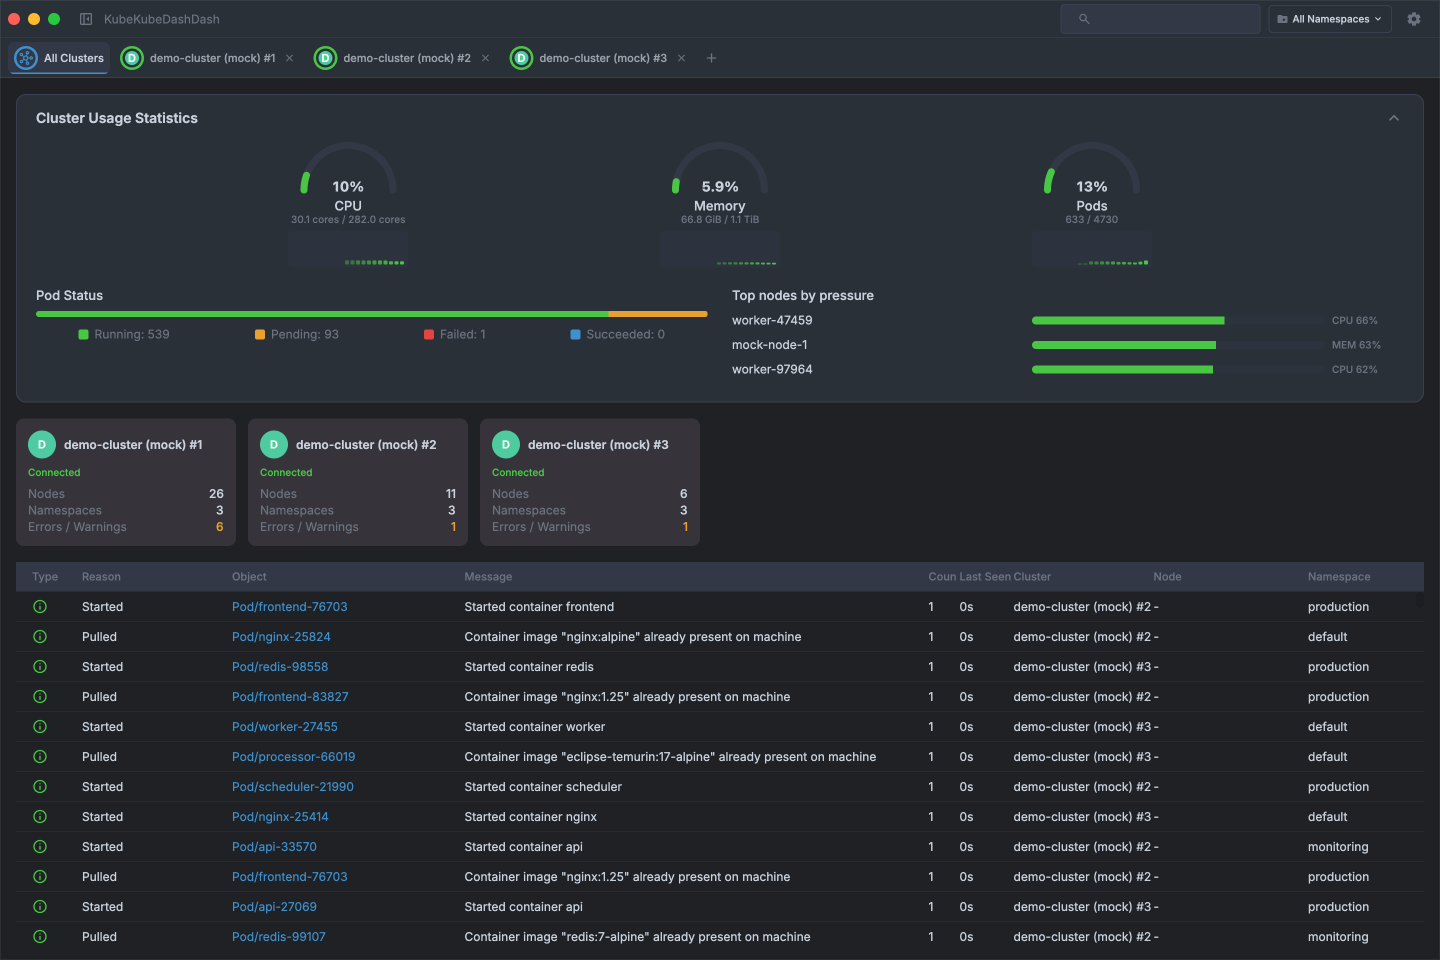
All clusters at a glance
Open more than one cluster and an extra tab appears — aggregated CPU, memory, and pod usage across every connected cluster, a card per cluster, and one merged event feed.
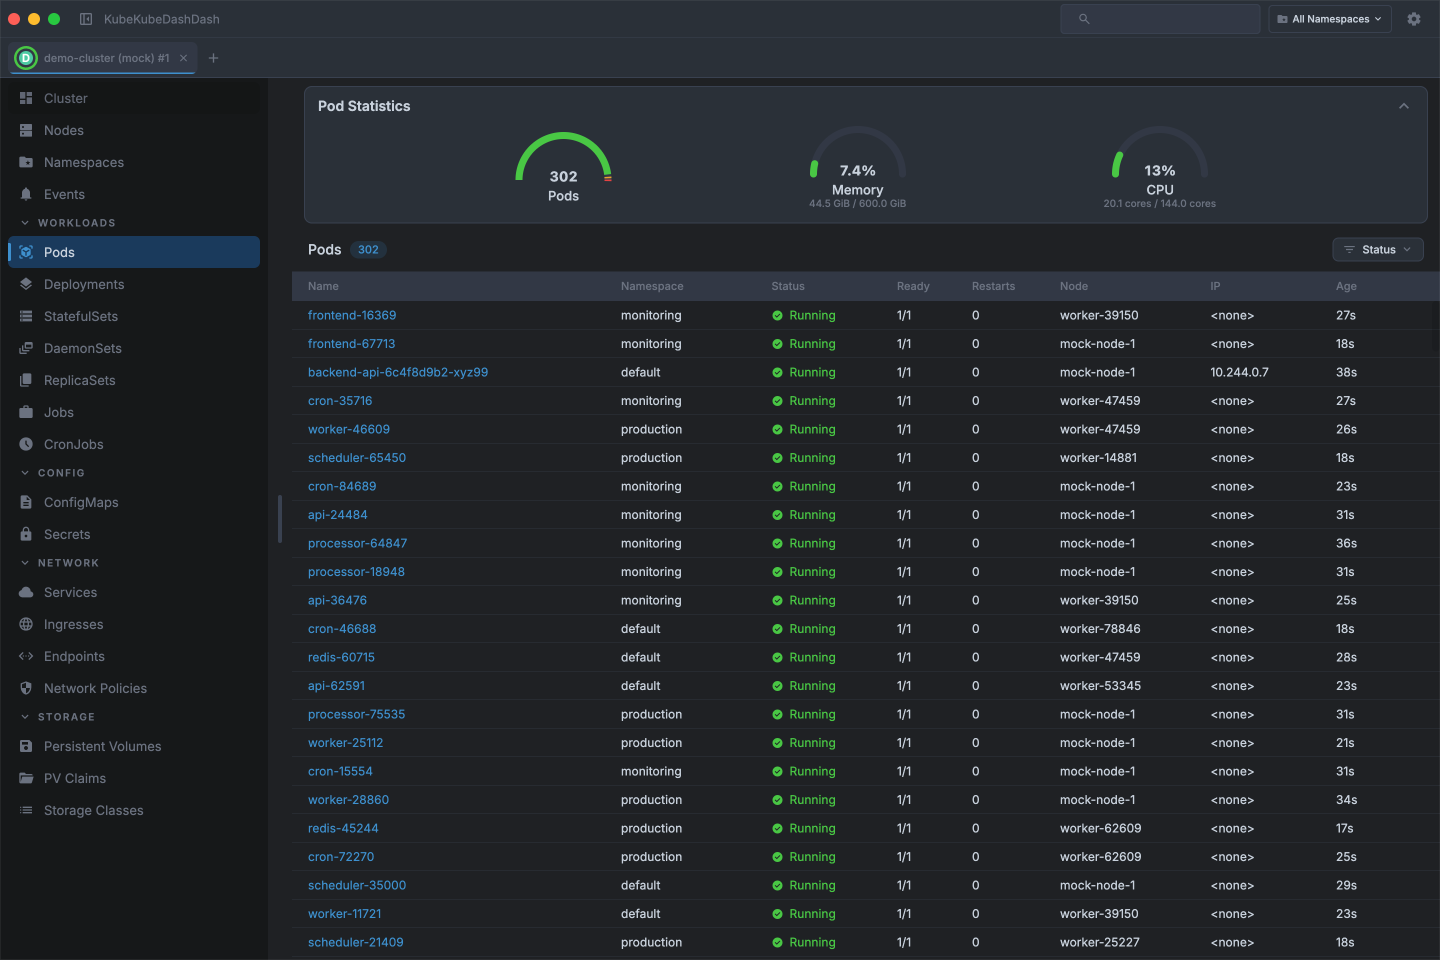
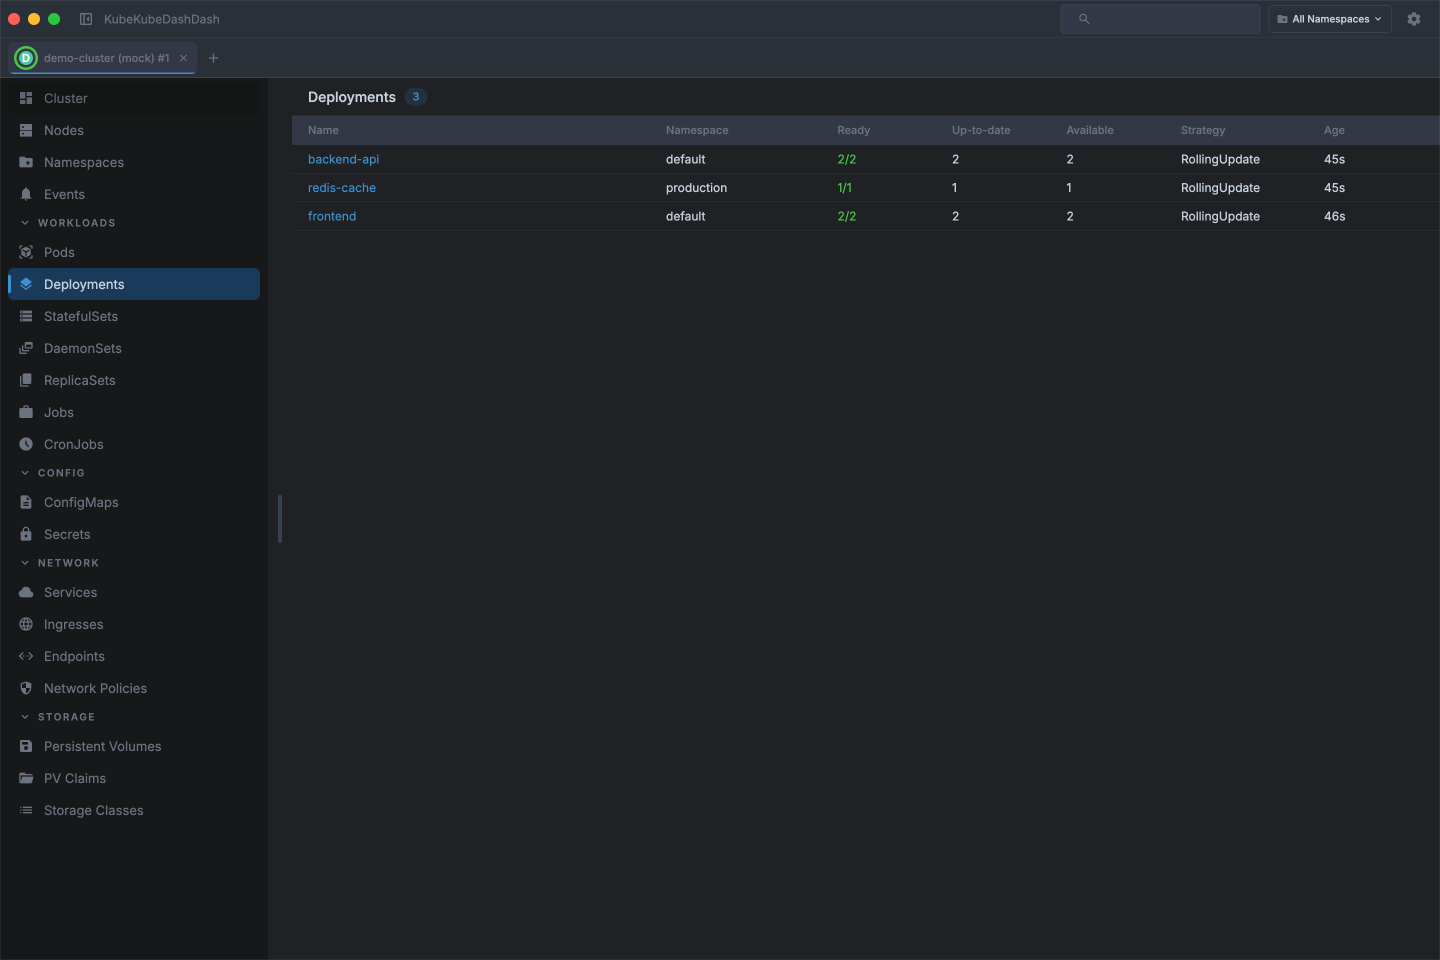
Workloads
Browse every workload across all namespaces, inspect replica counts and pod statuses, and drill into individual resources for full details.
Also available:
- StatefulSets
- DaemonSets
- ReplicaSets
- Jobs
- CronJobs
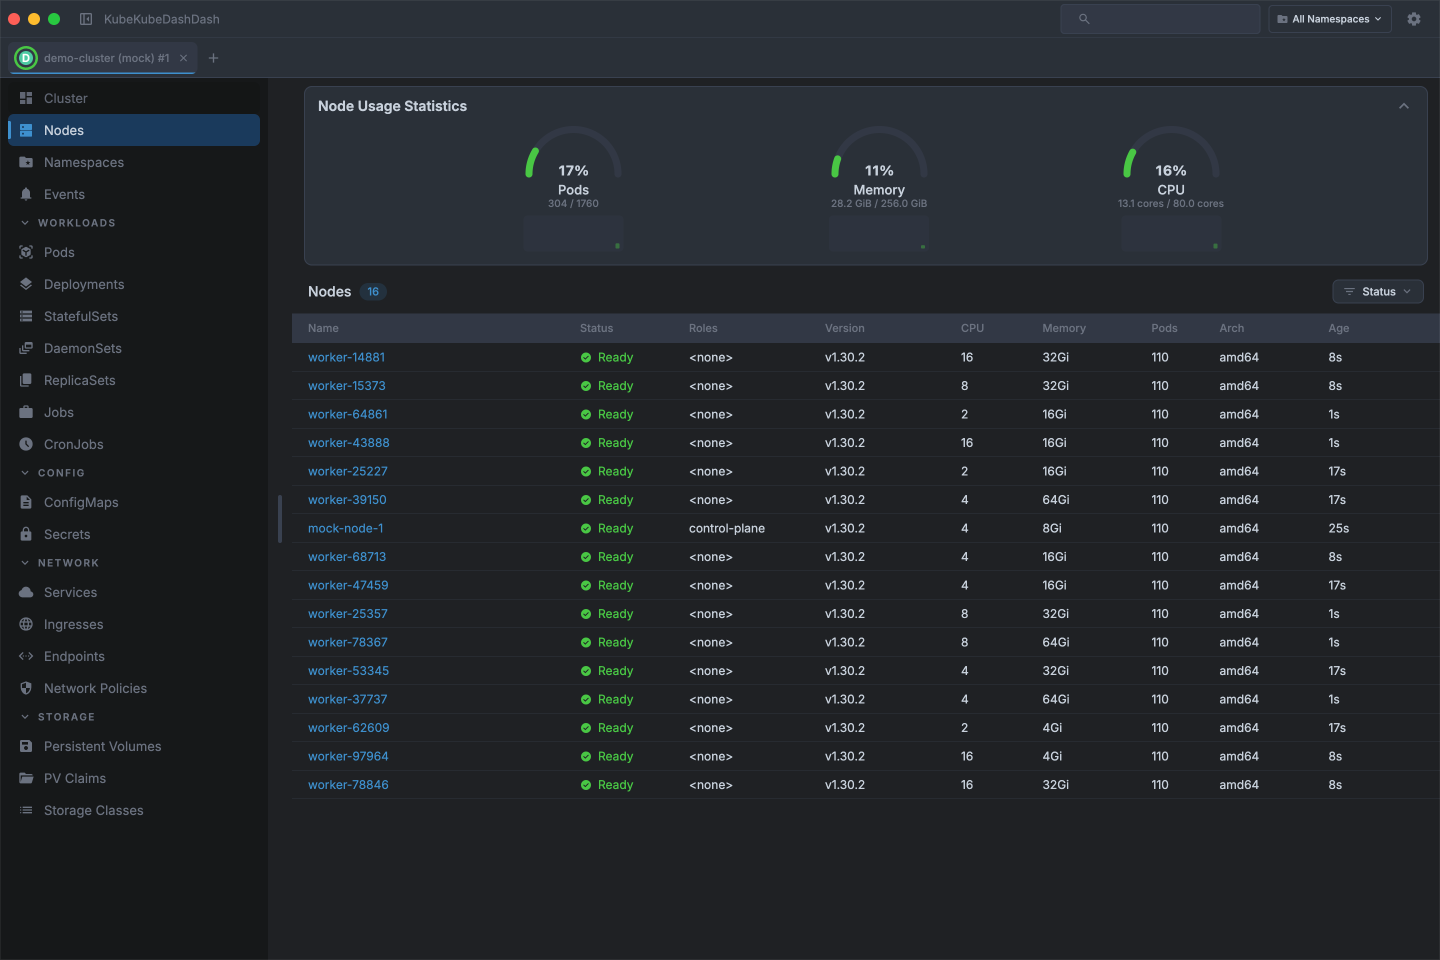
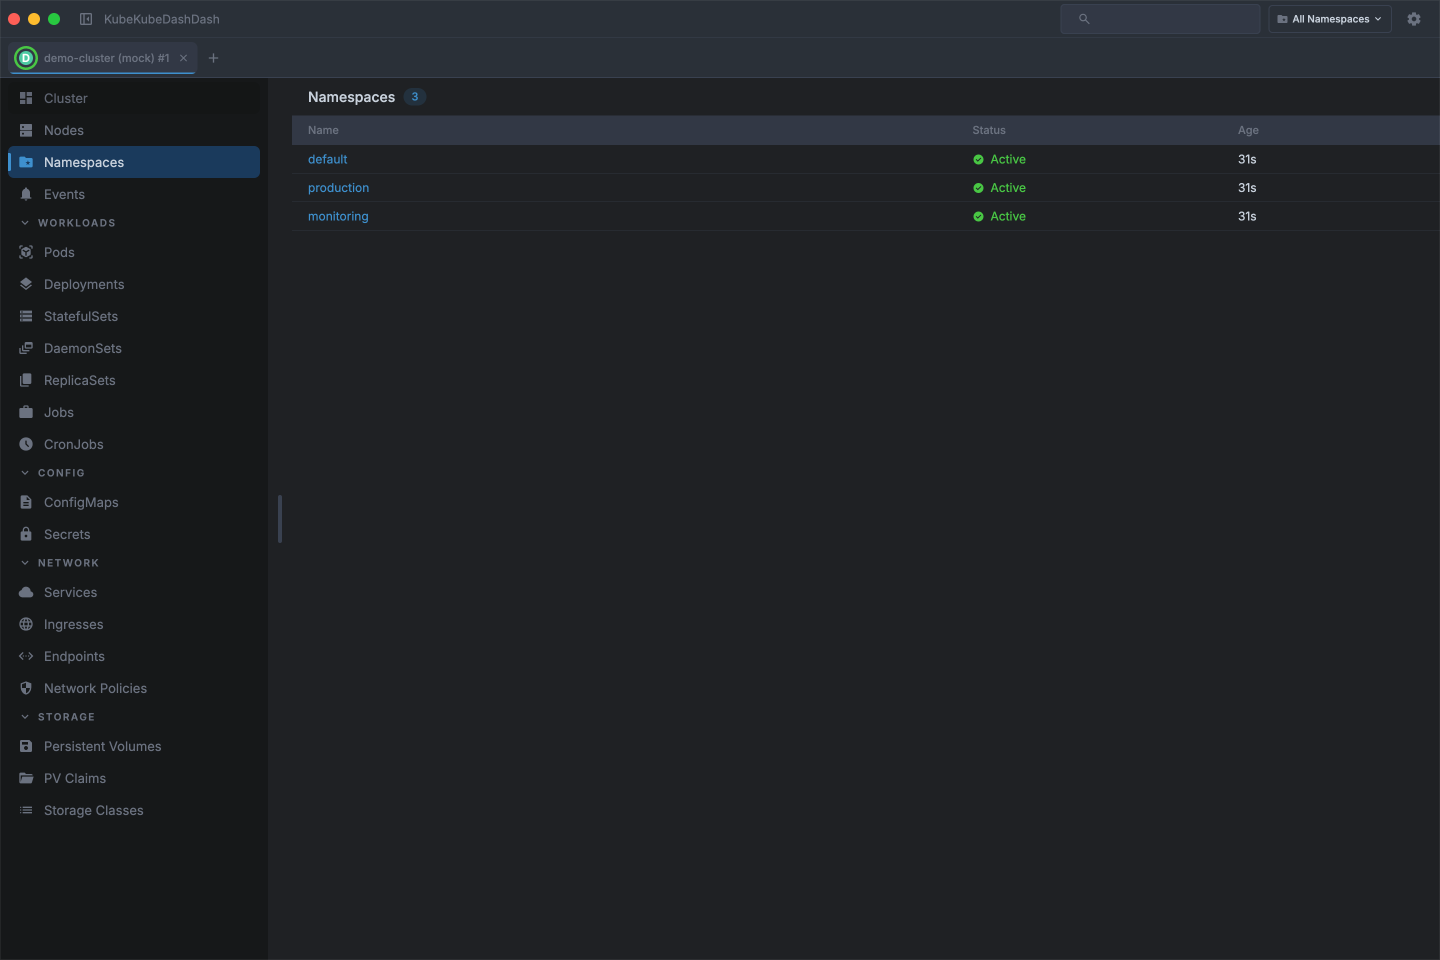
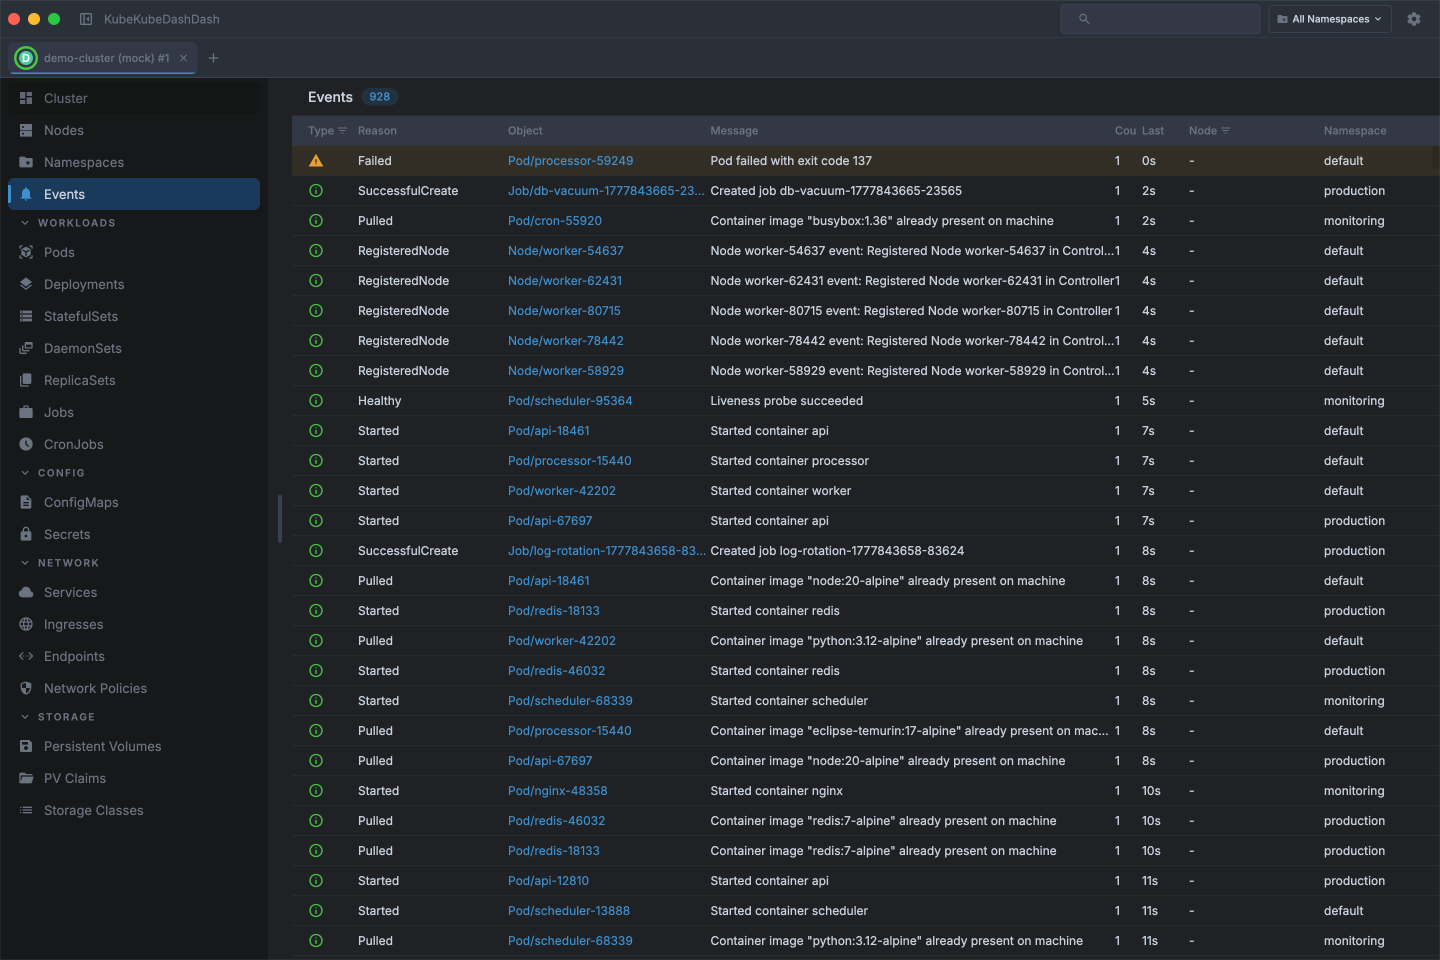
Cluster & nodes
Check node conditions and allocatable resources, navigate namespaces, and watch cluster events as they happen.
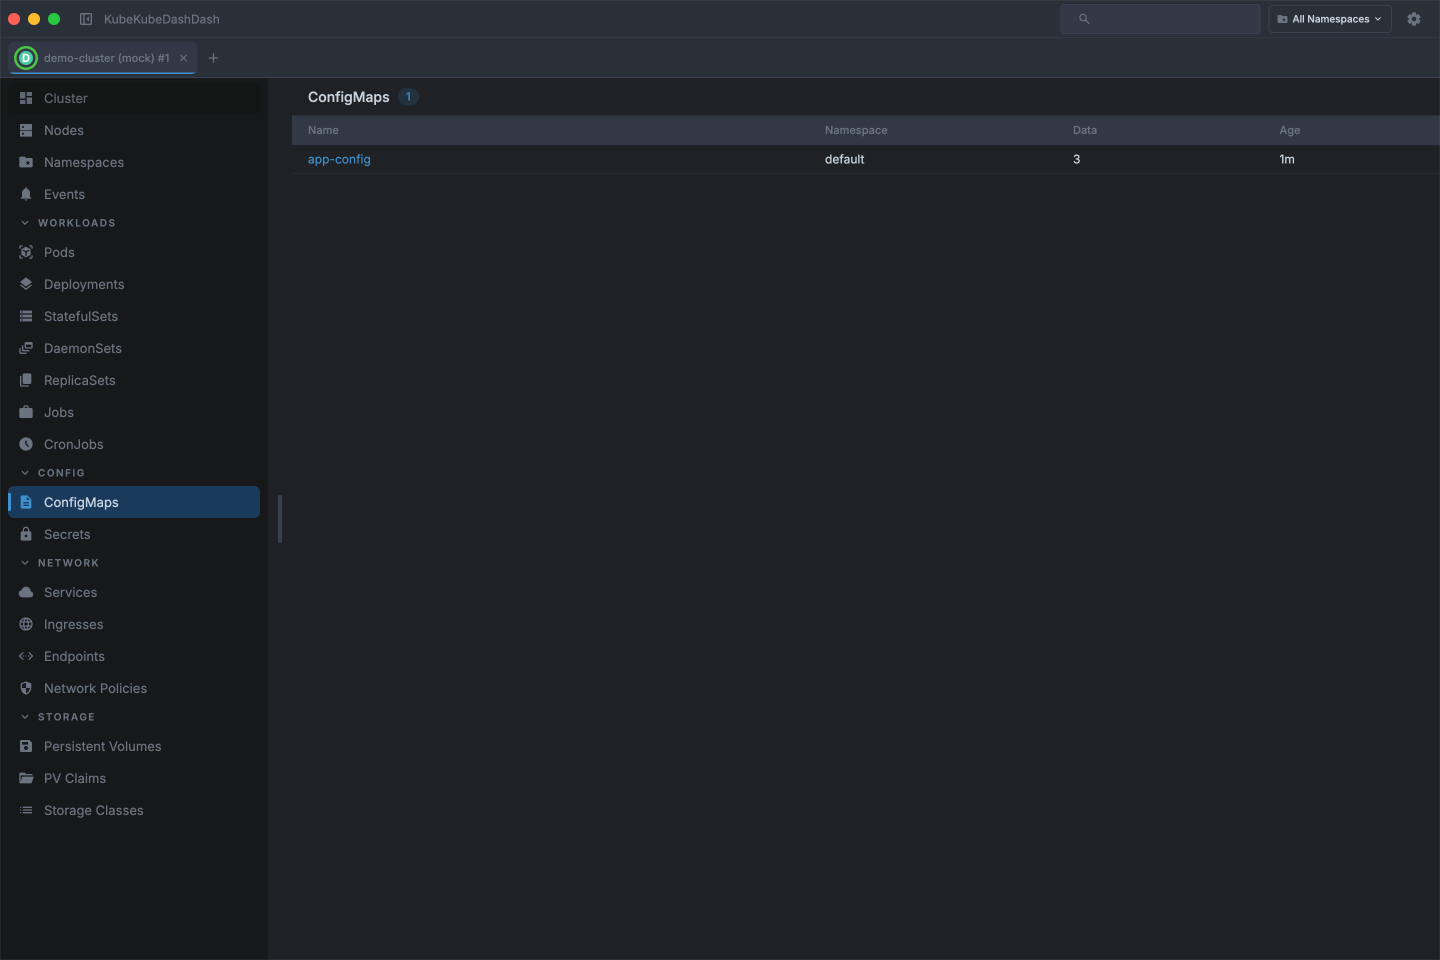
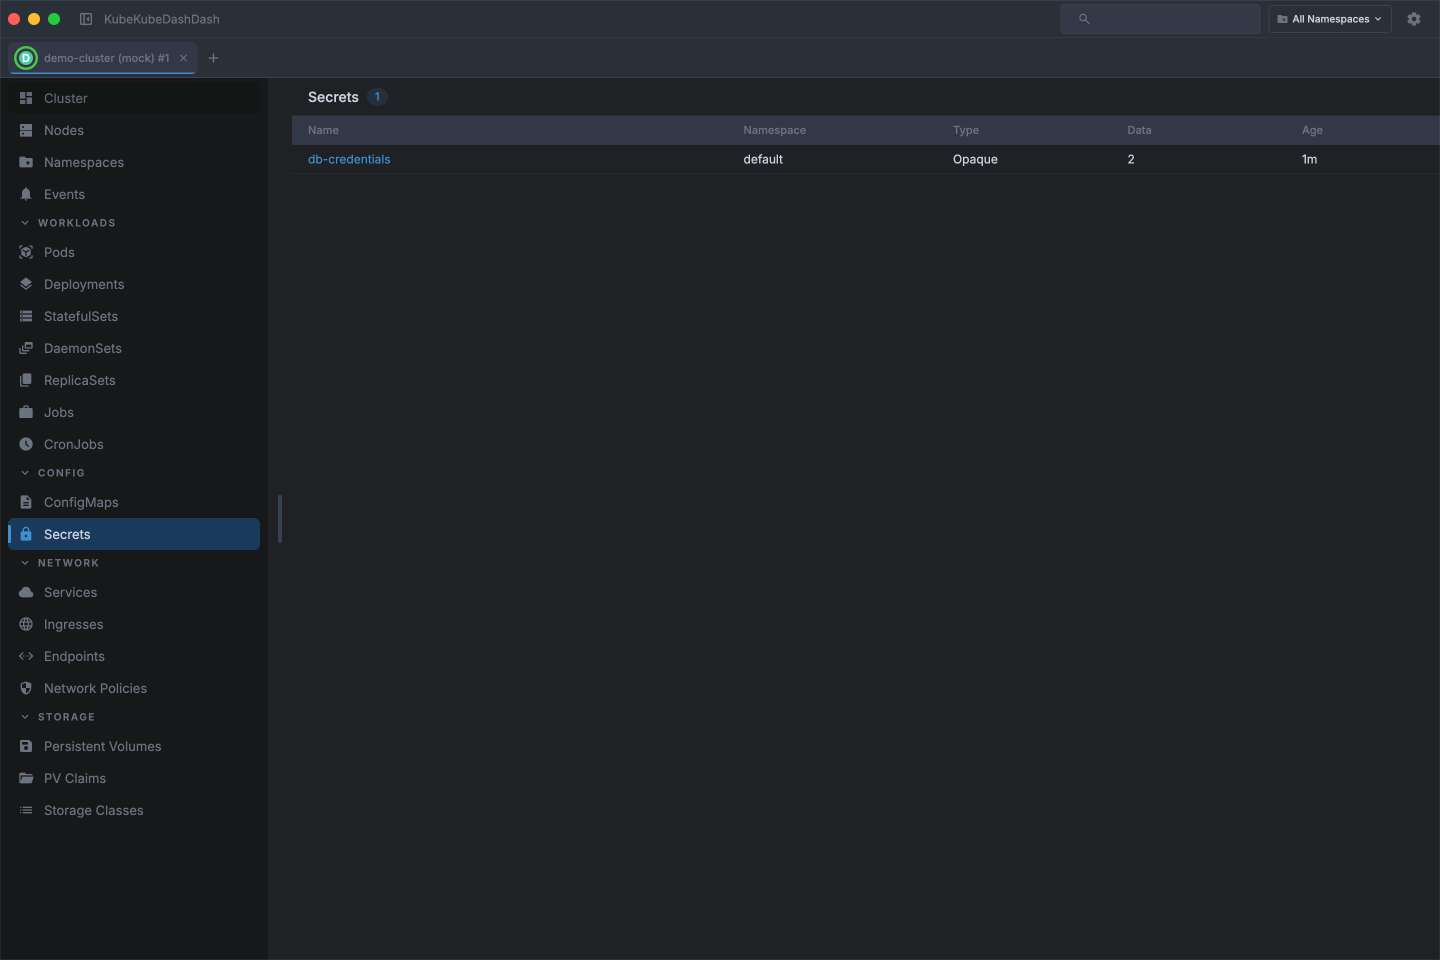
Config & secrets
Inspect ConfigMaps and Secrets across all namespaces and browse their keys and values without leaving the dashboard.
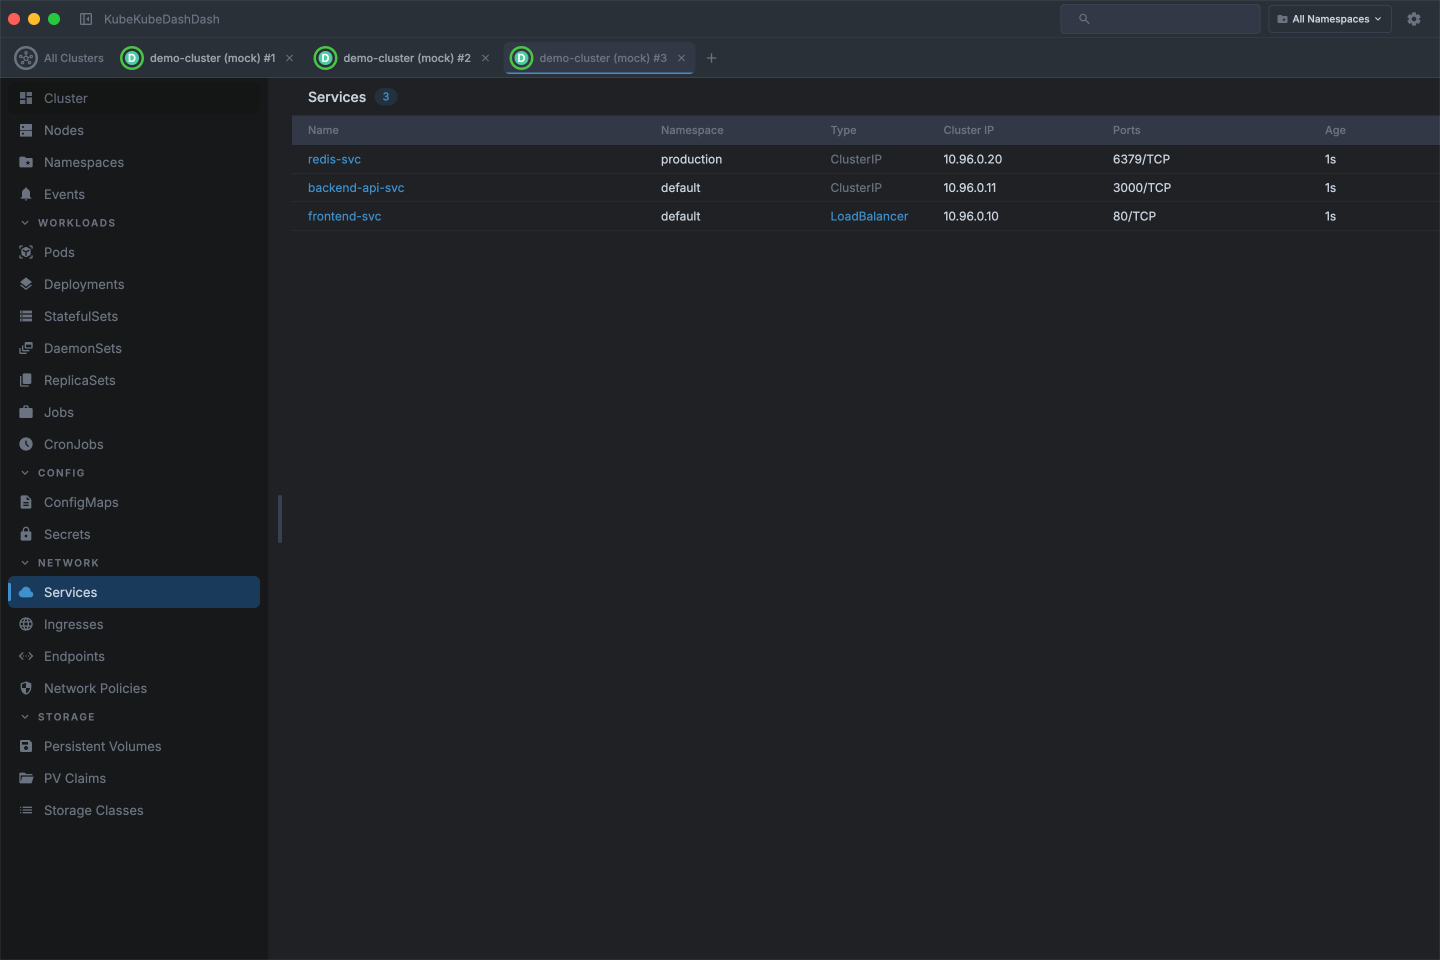
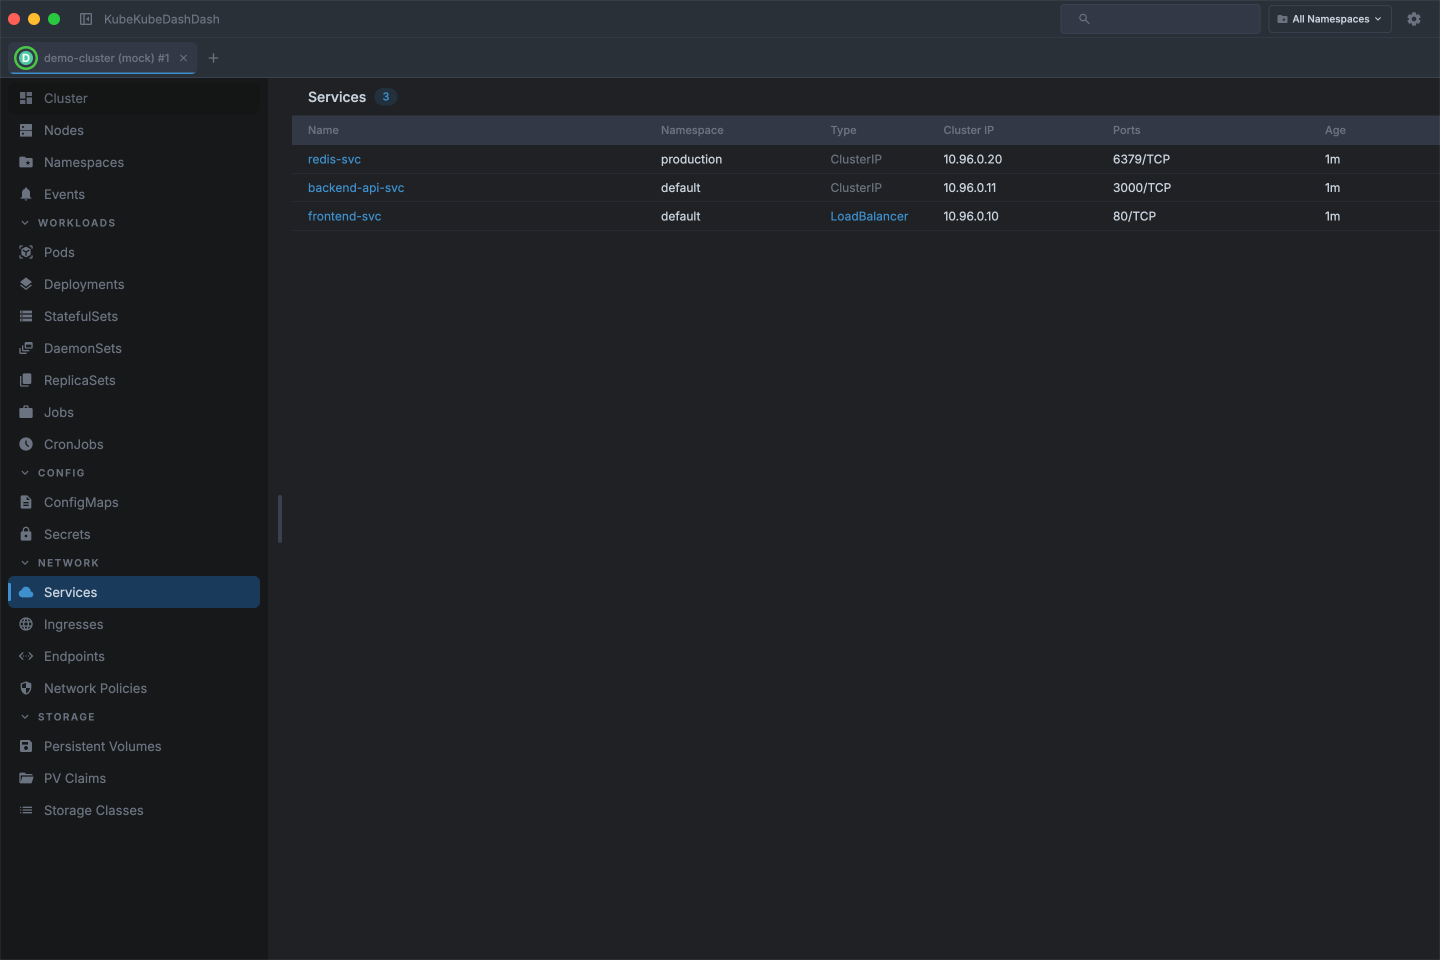
Networking
Map out your cluster's network layer — browse Services, Ingresses, Endpoints, and Network Policies in a consistent interface.
Also available:
- Ingresses
- Endpoints
- Network Policies
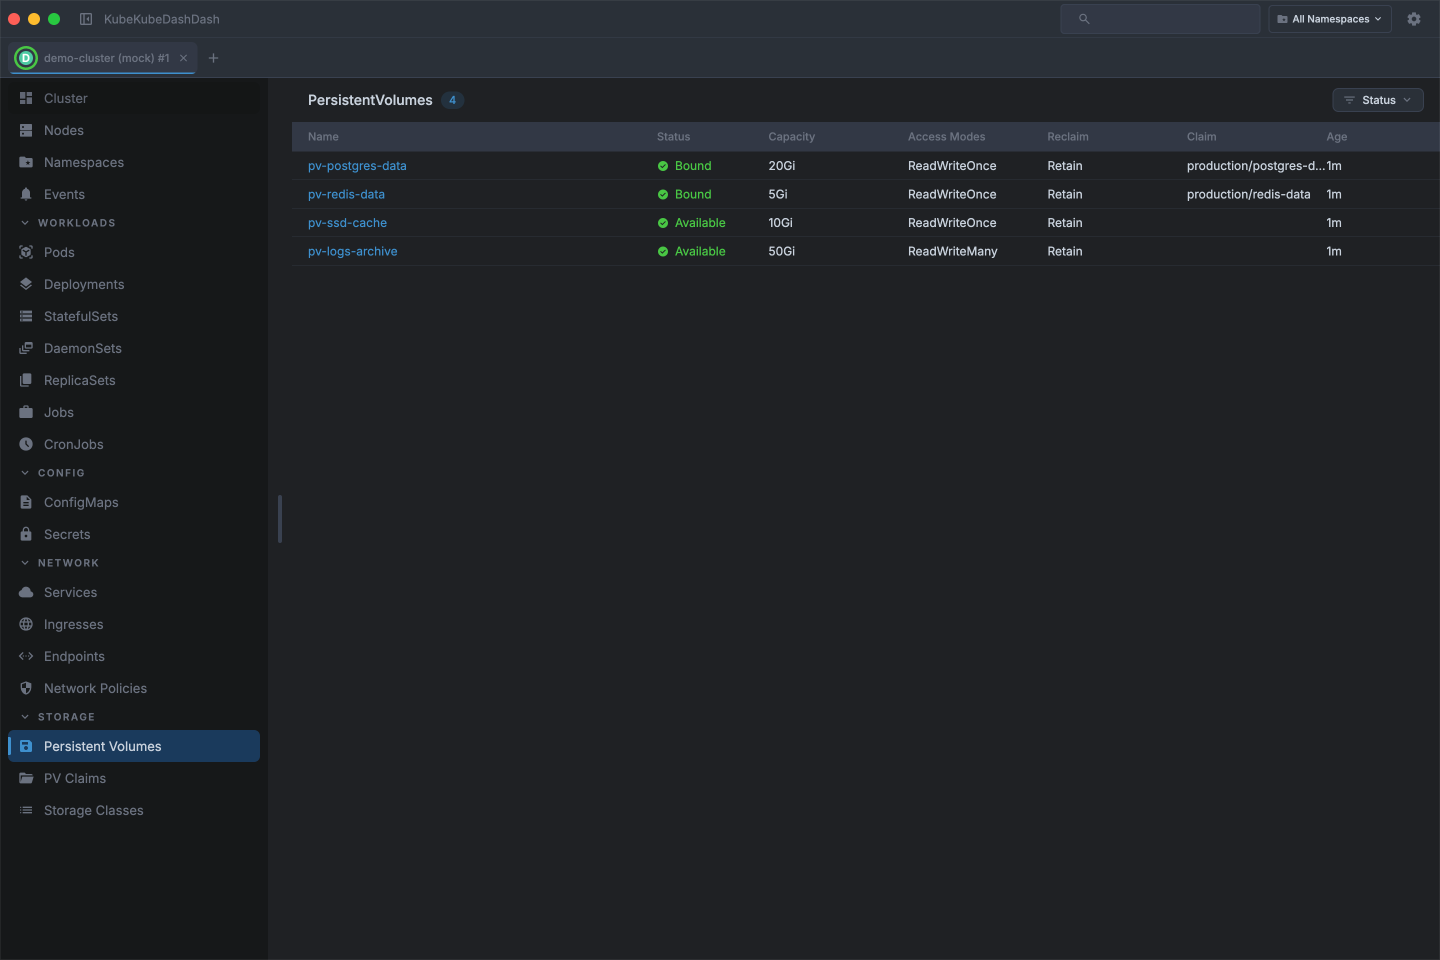
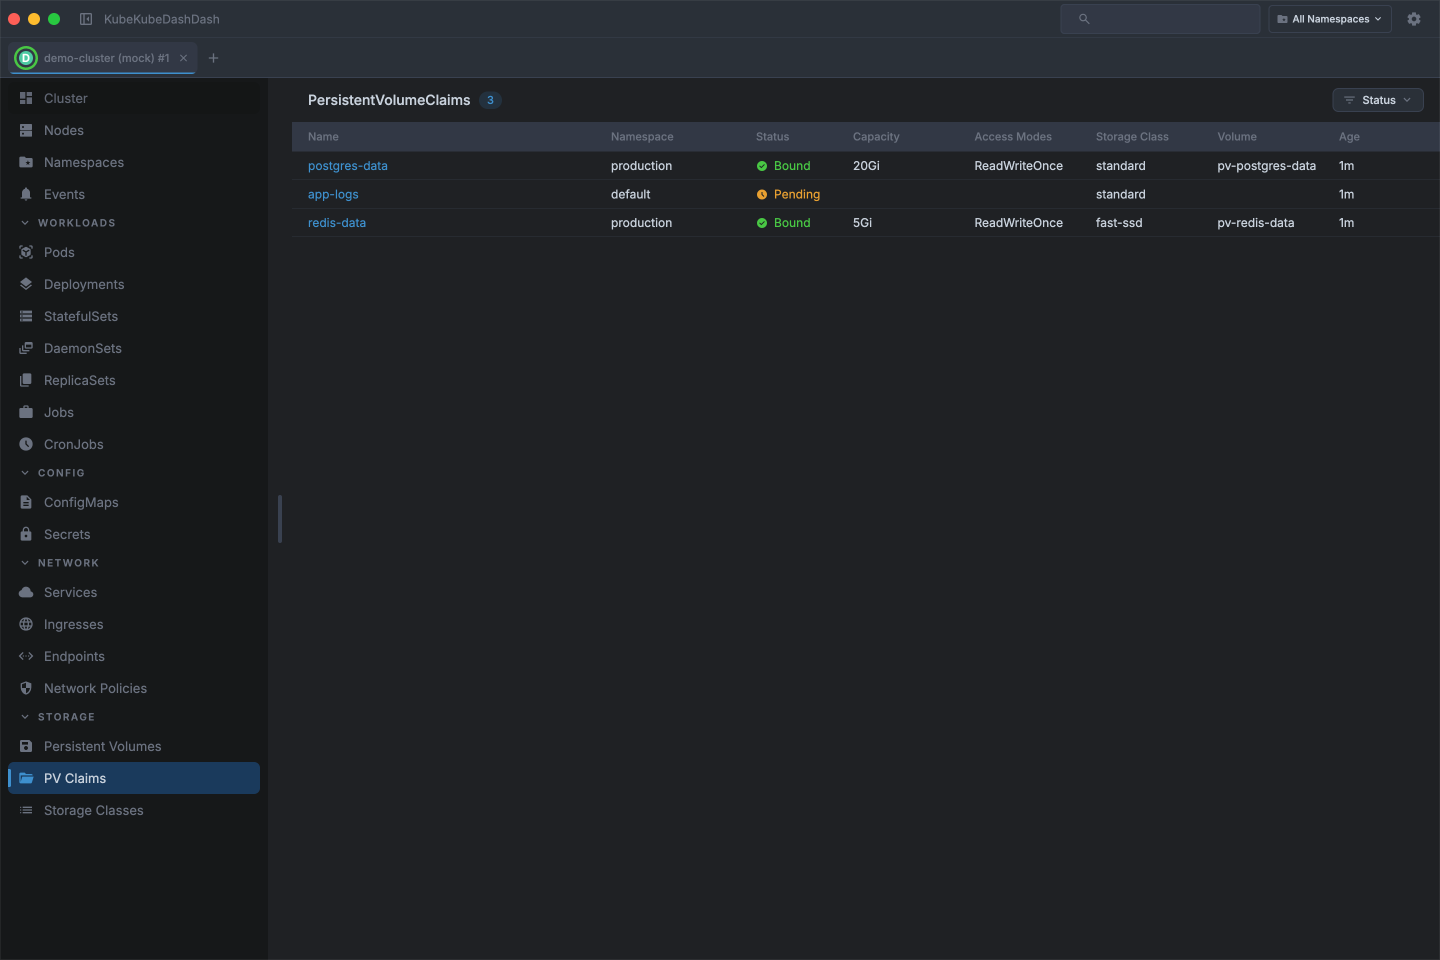
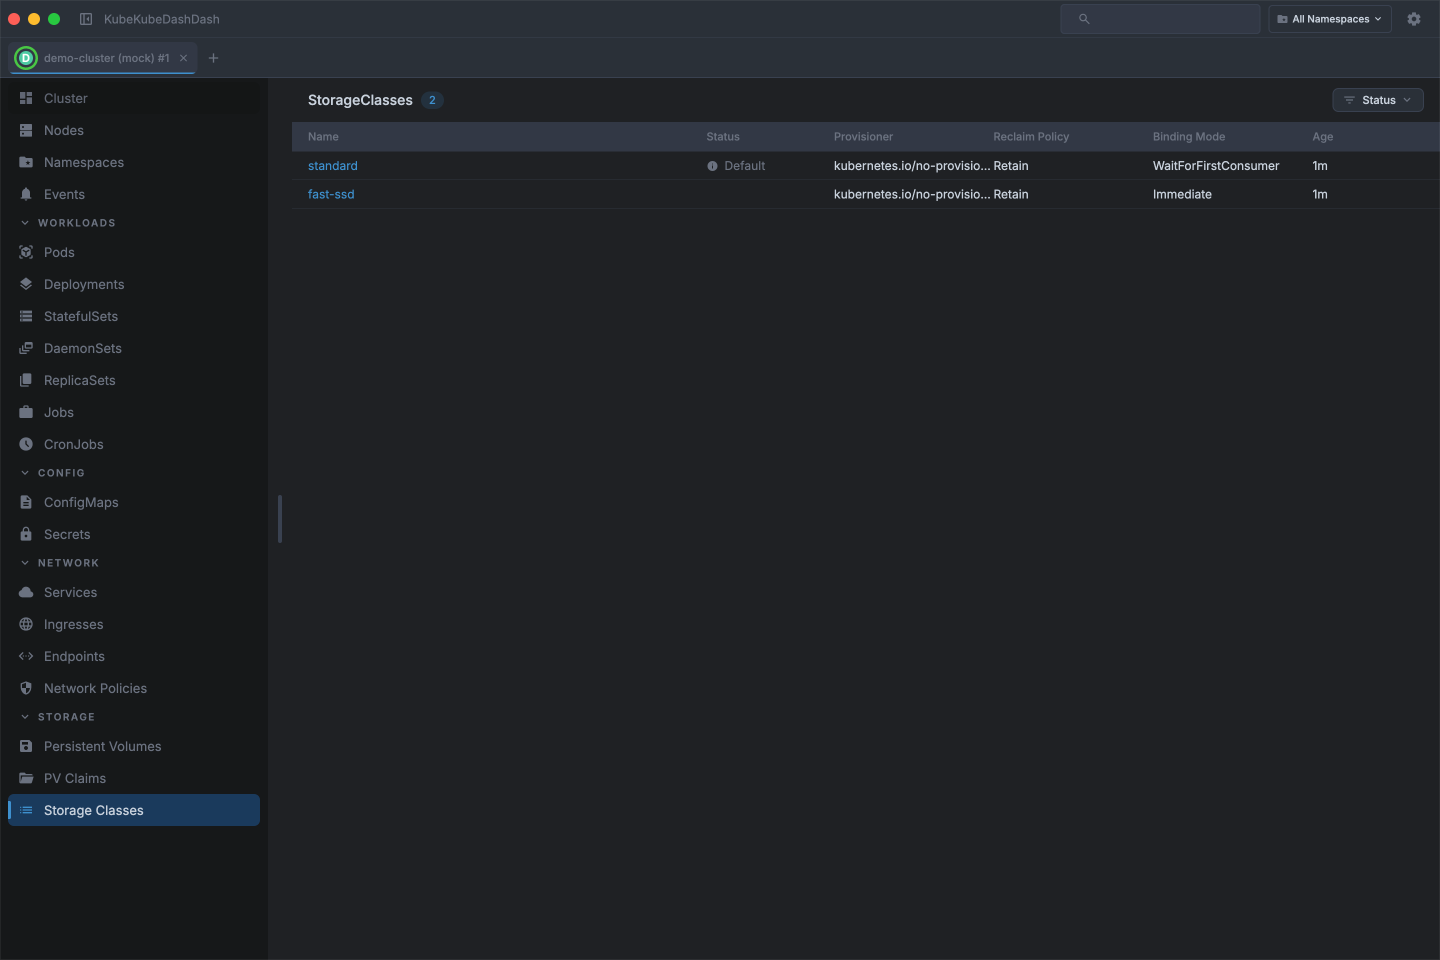
Storage
Track the lifecycle of your persistent volumes and claims — see capacity, access modes, and binding status across storage classes.
Settings
Switch themes, manage kubeconfig contexts, and configure app preferences — all without touching the command line.